sksurv.nonparametric.cumulative_incidence_competing_risks#
- sksurv.nonparametric.cumulative_incidence_competing_risks(event, time_exit, time_min=None, conf_level=0.95, conf_type=None, var_type='Aalen')[source]#
Non-parametric estimator of Cumulative Incidence function in the case of competing risks.
See the User Guide and [1] for further details.
- Parameters:
event (array-like, shape = (n_samples,), dtype = int) – Contains event indicators. A value of 0 indicates right-censoring, while a positive integer from 1 to n_risks corresponds to a specific risk. n_risks is the total number of different risks. It assumes there are events for all possible risks.
time_exit (array-like, shape = (n_samples,)) – Contains event or censoring times.
time_min (float, optional, default: None) – Compute estimator conditional on survival at least up to the specified time.
conf_level (float, optional, default: 0.95) – The level for a two-sided confidence interval on the cumulative incidence curves.
conf_type (None or {'log-log'}, optional, default: None.) – The type of confidence intervals to estimate. If None, no confidence intervals are estimated. If “log-log”, estimate confidence intervals using the log hazard or \(log(-log(S(t)))\).
var_type ({'Aalen', 'Dinse', 'Dinse_Approx'}, optional, default: 'Aalen') – The method for estimating the variance of the estimator. See [2], [3] and [4] for each of the methods. Only used if conf_type is not None.
- Returns:
time (ndarray, shape = (n_times,)) – Unique times.
cum_incidence (ndarray, shape = (n_risks + 1, n_times)) – Cumulative incidence for each risk. The first row (
cum_incidence[0]) is the cumulative incidence of any risk (total risk). The remaining rows (cum_incidence[1:]) are the cumulative incidences for each competing risk.conf_int (ndarray, shape = (n_risks + 1, 2, n_times)) – Pointwise confidence interval (second axis) of the cumulative incidence function at each unique time point (last axis) for all possible risks (first axis), including overall risk (
conf_int[0]). Only provided if conf_type is not None.
Examples
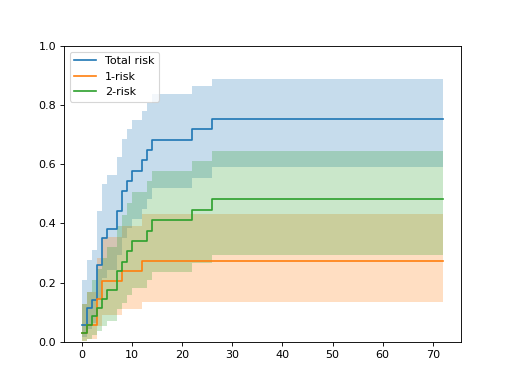
Creating cumulative incidence curves:
>>> import matplotlib.pyplot as plt
>>> from sksurv.datasets import load_bmt
>>> from sksurv.nonparametric import cumulative_incidence_competing_risks
>>>
>>> dis, bmt_df = load_bmt()
>>> event = bmt_df["status"]
>>> time = bmt_df["ftime"]
>>> n_risks = event.max()
>>>
>>> x, y, conf_int = cumulative_incidence_competing_risks(
...     event, time, conf_type="log-log"
... )
>>>
>>> plt.step(x, y[0], where="post", label="Total risk")
[...]
>>> plt.fill_between(x, conf_int[0, 0], conf_int[0, 1], alpha=0.25, step="post")
<matplotlib.collections.FillBetweenPolyCollection object at 0x...>
>>> for i in range(1, n_risks + 1):
...     plt.step(x, y[i], where="post", label=f"{i}-risk")
...     plt.fill_between(x, conf_int[i, 0], conf_int[i, 1], alpha=0.25, step="post")
[...]
<matplotlib.collections.FillBetweenPolyCollection object at 0x...>
>>> plt.ylim(0, 1)
(0.0, 1.0)
>>> plt.legend()
<matplotlib.legend.Legend object at 0x...>
>>> plt.show()
References