sksurv.linear_model.CoxPHSurvivalAnalysis#
- class sksurv.linear_model.CoxPHSurvivalAnalysis(alpha=0, *, ties='breslow', n_iter=100, tol=1e-09, verbose=0)[source]#
The Cox proportional hazards model, also known as Cox regression.
This model is a semi-parametric model that can be used to model the relationship between a set of features and the time to an event. The model is fitted by maximizing the partial likelihood using Newton-Raphson optimization.
There are two possible choices for handling tied event times. The default is Breslow’s method, which considers each of the events at a given time as distinct. Efron’s method is more accurate if there are a large number of ties. When the number of ties is small, the estimated coefficients by Breslow’s and Efron’s method are quite close.
See [1], [2], [3] for further description.
- Parameters:
alpha (float or ndarray, shape = (n_features,), optional, default: 0) – Regularization parameter for ridge regression penalty. If a single float, the same penalty is used for all features. If an array, there must be one penalty for each feature. If you want to include a subset of features without penalization, set the corresponding entries to 0.
ties ({'breslow', 'efron'}, optional, default: 'breslow') – The method to handle tied event times. If there are no tied event times all the methods are equivalent.
n_iter (int, optional, default: 100) – The maximum number of iterations taken for the solver to converge.
tol (float, optional, default: 1e-9) –
Convergence criteria. Convergence is based on the negative log-likelihood:
|1 - (new neg. log-likelihood / old neg. log-likelihood) | < tol
verbose (int, optional, default: 0) – Specifies the amount of additional debug information during optimization.
- coef_#
Coefficients of the model.
- Type:
ndarray, shape = (n_features,)
- cum_baseline_hazard_#
Estimated baseline cumulative hazard function.
- baseline_survival_#
Estimated baseline survival function.
- n_features_in_#
Number of features seen during
fit.- Type:
int
- feature_names_in_#
Names of features seen during
fit. Defined only when X has feature names that are all strings.- Type:
ndarray, shape = (n_features_in_,)
- unique_times_#
Unique time points.
- Type:
ndarray, shape = (n_unique_times,)
See also
sksurv.linear_model.CoxnetSurvivalAnalysisCox proportional hazards model with l1 (LASSO) and l2 (ridge) penalty.
References
Methods
__init__([alpha, ties, n_iter, tol, verbose])fit(X, y)Fit the model to the given data.
Get metadata routing of this object.
get_params([deep])Get parameters for this estimator.
predict(X)Predict risk scores.
predict_cumulative_hazard_function(X[, ...])Predict cumulative hazard function.
predict_survival_function(X[, return_array])Predict survival function.
score(X, y)Returns the concordance index of the prediction.
set_params(**params)Set the parameters of this estimator.
Attributes
- fit(X, y)[source]#
Fit the model to the given data.
- Parameters:
X (array-like, shape = (n_samples, n_features)) – Data matrix
y (structured array, shape = (n_samples,)) – A structured array with two fields. The first field is a boolean where
Trueindicates an event andFalseindicates right-censoring. The second field is a float with the time of event or time of censoring.
- Return type:
self
- get_metadata_routing()#
Get metadata routing of this object.
Please check User Guide on how the routing mechanism works.
- Returns:
routing – A
MetadataRequestencapsulating routing information.- Return type:
MetadataRequest
- get_params(deep=True)#
Get parameters for this estimator.
- Parameters:
deep (bool, default=True) – If True, will return the parameters for this estimator and contained subobjects that are estimators.
- Returns:
params – Parameter names mapped to their values.
- Return type:
dict
- predict(X)[source]#
Predict risk scores.
The risk score is the linear predictor of the model, computed as the dot product of the input features X and the estimated coefficients coef_. A higher score indicates a higher risk of experiencing the event.
- Parameters:
X (array-like, shape = (n_samples, n_features)) – Data matrix.
- Returns:
risk_score – Predicted risk scores.
- Return type:
array, shape = (n_samples,)
- predict_cumulative_hazard_function(X, return_array=False)[source]#
Predict cumulative hazard function.
The cumulative hazard function for an individual with feature vector \(x\) is defined as
\[H(t \mid x) = \exp(x^\top \beta) H_0(t) ,\]where \(H_0(t)\) is the baseline hazard function, estimated by Breslow’s estimator.
- Parameters:
X (array-like, shape = (n_samples, n_features)) – Data matrix.
return_array (bool, default: False) –
Whether to return a single array of cumulative hazard values or a list of step functions.
If False, a list of
sksurv.functions.StepFunctionobjects is returned.If True, a 2d-array of shape (n_samples, n_unique_times) is returned, where n_unique_times is the number of unique event times in the training data. Each row represents the cumulative hazard function of an individual evaluated at unique_times_.
- Returns:
cum_hazard – If return_array is False, an array of n_samples
sksurv.functions.StepFunctioninstances is returned.If return_array is True, a numeric array of shape (n_samples, n_unique_times_) is returned.
- Return type:
ndarray
Examples
>>> import matplotlib.pyplot as plt
>>> from sksurv.datasets import load_veterans_lung_cancer
>>> from sksurv.preprocessing import OneHotEncoder
>>> from sksurv.linear_model import CoxPHSurvivalAnalysis
Load the data and encode categorical features.
>>> X, y = load_veterans_lung_cancer()
>>> Xt = OneHotEncoder().fit_transform(X)
Fit the model.
>>> estimator = CoxPHSurvivalAnalysis().fit(Xt, y)
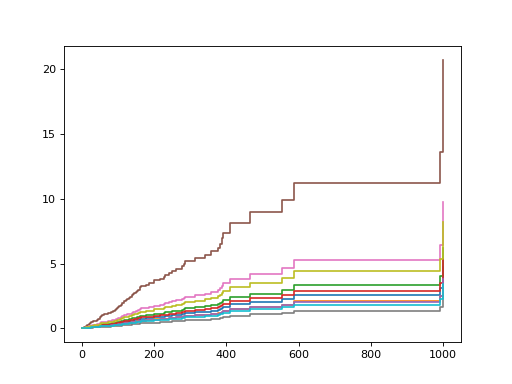
Estimate the cumulative hazard function for the first 10 samples.
>>> chf_funcs = estimator.predict_cumulative_hazard_function(Xt.iloc[:10])
Plot the estimated cumulative hazard functions.
>>> for fn in chf_funcs:
...     plt.step(fn.x, fn(fn.x), where="post")
...
[...]
>>> plt.show()
- predict_survival_function(X, return_array=False)[source]#
Predict survival function.
The survival function for an individual with feature vector \(x\) is defined as
\[S(t \mid x) = S_0(t)^{\exp(x^\top \beta)} ,\]where \(S_0(t)\) is the baseline survival function, estimated by Breslow’s estimator.
- Parameters:
X (array-like, shape = (n_samples, n_features)) – Data matrix.
return_array (bool, default: False) –
Whether to return a single array of survival probabilities or a list of step functions.
If False, a list of
sksurv.functions.StepFunctionobjects is returned.If True, a 2d-array of shape (n_samples, n_unique_times) is returned, where n_unique_times is the number of unique event times in the training data. Each row represents the survival function of an individual evaluated at unique_times_.
- Returns:
survival – If return_array is False, an array of n_samples
sksurv.functions.StepFunctioninstances is returned.If return_array is True, a numeric array of shape (n_samples, n_unique_times_) is returned.
- Return type:
ndarray
Examples
>>> import matplotlib.pyplot as plt
>>> from sksurv.datasets import load_veterans_lung_cancer
>>> from sksurv.preprocessing import OneHotEncoder
>>> from sksurv.linear_model import CoxPHSurvivalAnalysis
Load the data and encode categorical features.
>>> X, y = load_veterans_lung_cancer()
>>> Xt = OneHotEncoder().fit_transform(X)
Fit the model.
>>> estimator = CoxPHSurvivalAnalysis().fit(Xt, y)
Estimate the survival function for the first 10 samples.
>>> surv_funcs = estimator.predict_survival_function(Xt.iloc[:10])
Plot the estimated survival functions.
>>> for fn in surv_funcs:
...     plt.step(fn.x, fn(fn.x), where="post")
...
[...]
>>> plt.ylim(0, 1)
(0.0, 1.0)
>>> plt.show()

- score(X, y)[source]#
Returns the concordance index of the prediction.
- Parameters:
X (array-like, shape = (n_samples, n_features)) – Test samples.
y (structured array, shape = (n_samples,)) – A structured array containing the binary event indicator as first field, and time of event or time of censoring as second field.
- Returns:
cindex – Estimated concordance index.
- Return type:
float
See also
sksurv.metrics.concordance_index_censoredComputes the concordance index.
- set_params(**params)#
Set the parameters of this estimator.
The method works on simple estimators as well as on nested objects (such as
Pipeline). The latter have parameters of the form<component>__<parameter>so that it’s possible to update each component of a nested object.- Parameters:
**params (dict) – Estimator parameters.
- Returns:
self – Estimator instance.
- Return type:
estimator instance