sksurv.nonparametric.kaplan_meier_estimator#
- sksurv.nonparametric.kaplan_meier_estimator(event, time_exit, time_enter=None, time_min=None, reverse=False, conf_level=0.95, conf_type=None)[source]#
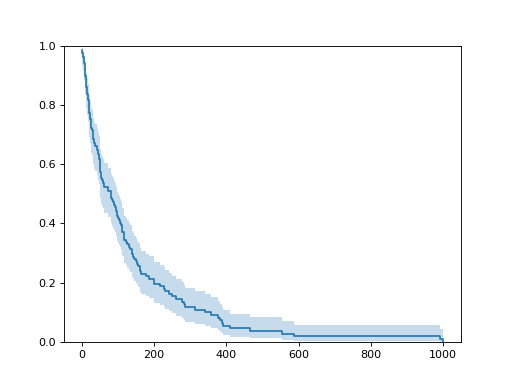
Computes the Kaplan-Meier estimate of the survival function.
See [1] for further description.
- Parameters:
event (array-like, shape = (n_samples,)) – A boolean array where
Trueindicates an event andFalseindicates right-censoring.time_exit (array-like, shape = (n_samples,)) – Time of event or censoring.
time_enter (array-like, shape = (n_samples,), optional) – Contains time when each individual entered the study for left truncated survival data.
time_min (float, optional) – Compute estimator conditional on survival at least up to the specified time.
reverse (bool, optional, default: False) – Whether to estimate the censoring distribution. When there are ties between times at which events are observed, then events come first and are subtracted from the denominator. Only available for right-censored data, i.e. time_enter must be None.
conf_level (float, optional, default: 0.95) – The level for a two-sided confidence interval on the survival curves.
conf_type (None or {'log-log'}, optional, default: None.) – The type of confidence intervals to estimate. If None, no confidence intervals are estimated. If “log-log”, estimate confidence intervals using the log hazard or \(log(-log(S(t)))\) as described in [2].
- Returns:
time (ndarray, shape = (n_times,)) – Unique times.
prob_survival (ndarray, shape = (n_times,)) – Survival probability at each unique time point. If time_enter is provided, estimates are conditional probabilities.
conf_int (ndarray, shape = (2, n_times)) – Pointwise confidence interval of the Kaplan-Meier estimator at each unique time point. Only provided if conf_type is not None.
Examples
Creating a Kaplan-Meier curve:
>>> import matplotlib.pyplot as plt
>>> from sksurv.datasets import load_veterans_lung_cancer
>>> from sksurv.nonparametric import kaplan_meier_estimator
>>>
>>> _, y = load_veterans_lung_cancer()
>>> time, prob_surv, conf_int = kaplan_meier_estimator(
...     y["Status"], y["Survival_in_days"], conf_type="log-log"
... )
>>> plt.step(time, prob_surv, where="post")
[...]
>>> plt.fill_between(time, conf_int[0], conf_int[1], alpha=0.25, step="post")
<matplotlib.collections.FillBetweenPolyCollection object at 0x...>
>>> plt.ylim(0, 1)
(0.0, 1.0)
>>> plt.show()
See also
sksurv.nonparametric.SurvivalFunctionEstimatorEstimator API of the Kaplan-Meier estimator.
References